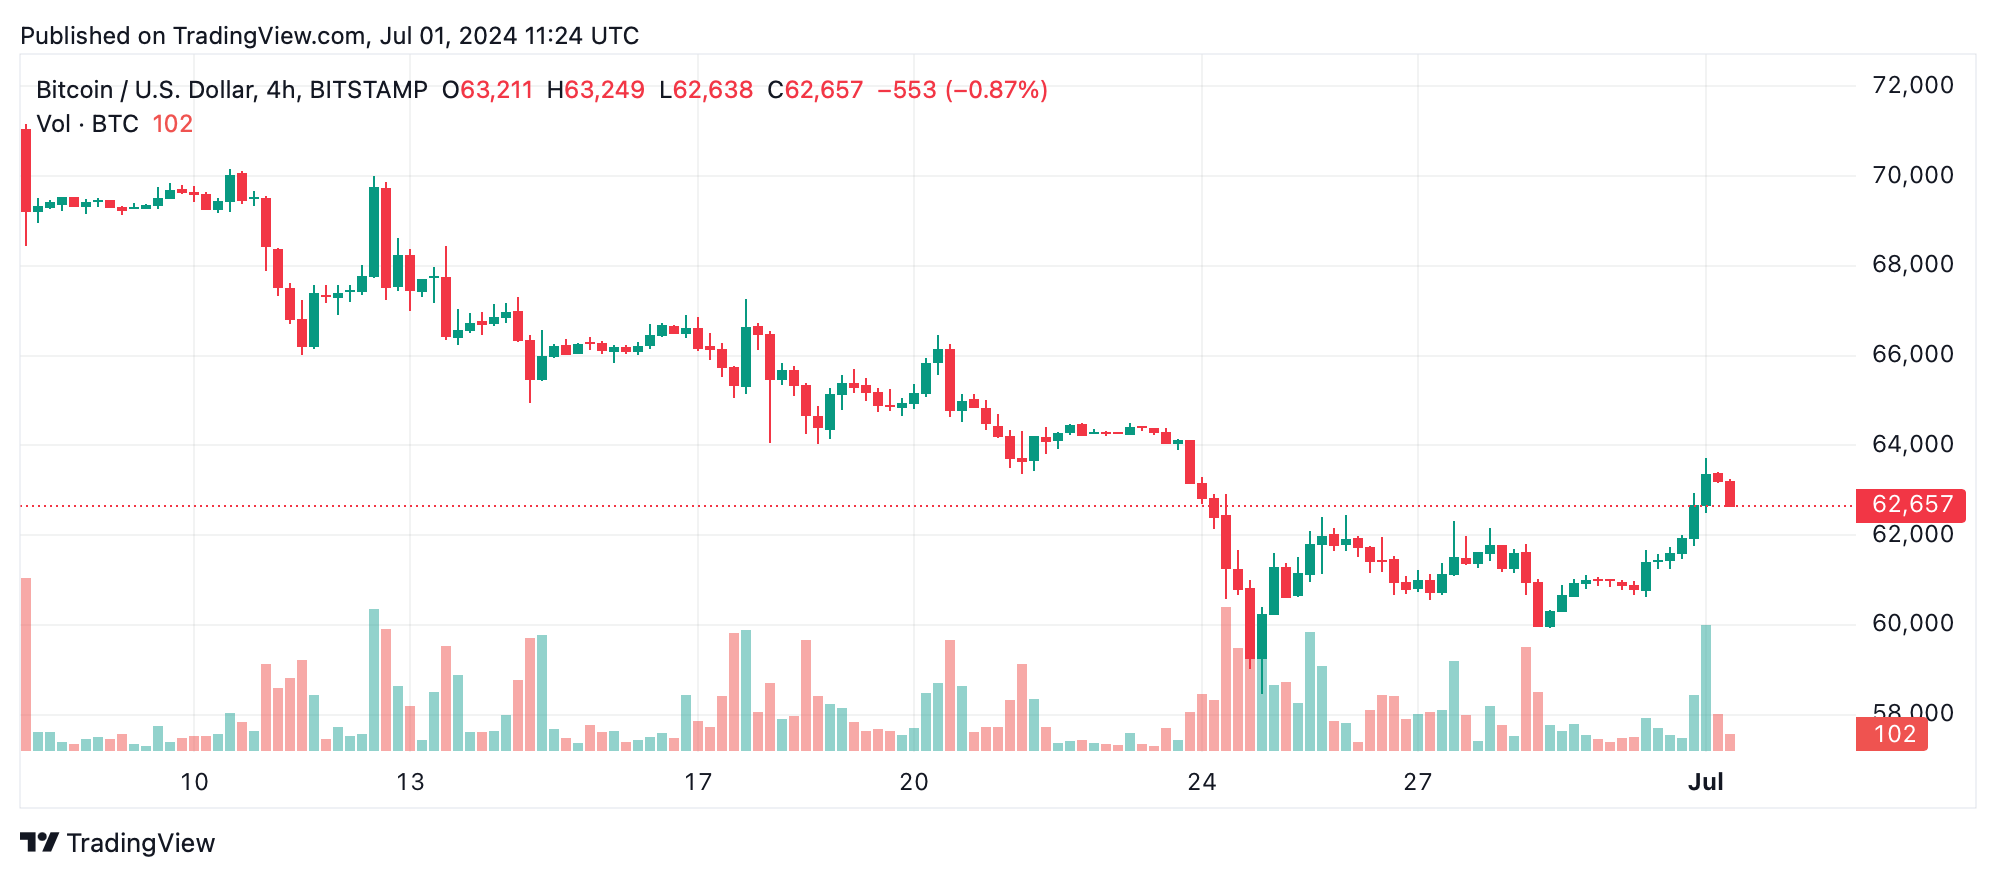
Yesterday, Bitcoin price surged above $63,000 and continued to trade within a daily range of $61,261 to $63,694. The market cap rose to around $1.237 trillion and the king coin managed to attract a daily trading volume of $21.98 billion. However, despite the rise, BTC continues to give mixed signals on the charts.
The graphs
The 1-hour chart of Bitcoin (BTC) shows a strong increase from $60,620, peaking at $63,724, followed by a slight decline. The increased volume during the price increase indicates strong buying interest. A strategic entry price is around $62,500 to $63,000, with a short-term target around $64,000 if consolidation and reversal occur.
The 4-hours chart reflects this trend, with a rise from a low of $59,923 to a high of $63,724, followed by a slight correction. Volume is supporting the price movement, with a significant spike above $60,000. A suggested entry point is around $62,500, at the lower end of the current consolidation zone.

The daily chart shows a broader picture: A drop from $71,949 to $58,456, followed by a recovery to $63,724. Volume remains steady with spikes during major price moves. An ideal entry point is around $62,000 to $63,000, provided the price stays above $60,000.
Technical Indicators
Oscillators are mixed. The RSI at 44 and Stochastic at 43 are neutral. The CCI at -32 and ADX at 33 also suggest a lack of strong direction. The momentum indicator at -1352 points to a buying opportunity, while the MACD at -1530 points to selling pressure. These mixed signals call for cautious optimism, with attention to further market developments.
Moving averages
The 10-period EMA and SMA suggest a buying trend with respective values of $62,360 and $61,847. The 20, 30, 50 and 100-period EMAs and SMAs are giving sell signals except the 200-period EMA and SMA which are giving buy recommendations at $58,195 and $58,212. This indicates a short-term bullish outlook but possible long-term resistance unless significant support levels are held.
Bullish signals
The market outlook for Bitcoin on July 1, 2024 is cautiously positive, with entry levels around $62,500 and exit levels around $63,724. The trend suggests a potential for further upside if critical support levels are held and buying interest persists.
Bearish signals
Despite some positive signs, the Bitcoin market is also showing several sell signals from moving averages and mixed oscillator readings on July 1, 2024. Traders should remain cautious and watch for potential downward pressure if key support levels fail to hold.
Source: https://cryptobenelux.com/2024/07/02/bitcoin-koers-stijgt-en-vertoont-zowel-bearish-als-bullish-signalen/


