The 2024 Bitcoin Halving has been completed, so it is high time for a new Bitcoin Update. Currently, the bitcoin price is hovering around $64,000, and remarkably, we have seen little price action during the halving. Historically, it seems that the halving has a very positive effect on the price in the medium term, and we do not doubt this for a second.
In the short term, however, we do face some challenges that we must overcome in order to look upwards. Will we see a drop to $50,000 first, or will we start chasing new highs from this point?
Bitcoin (BTC) graph
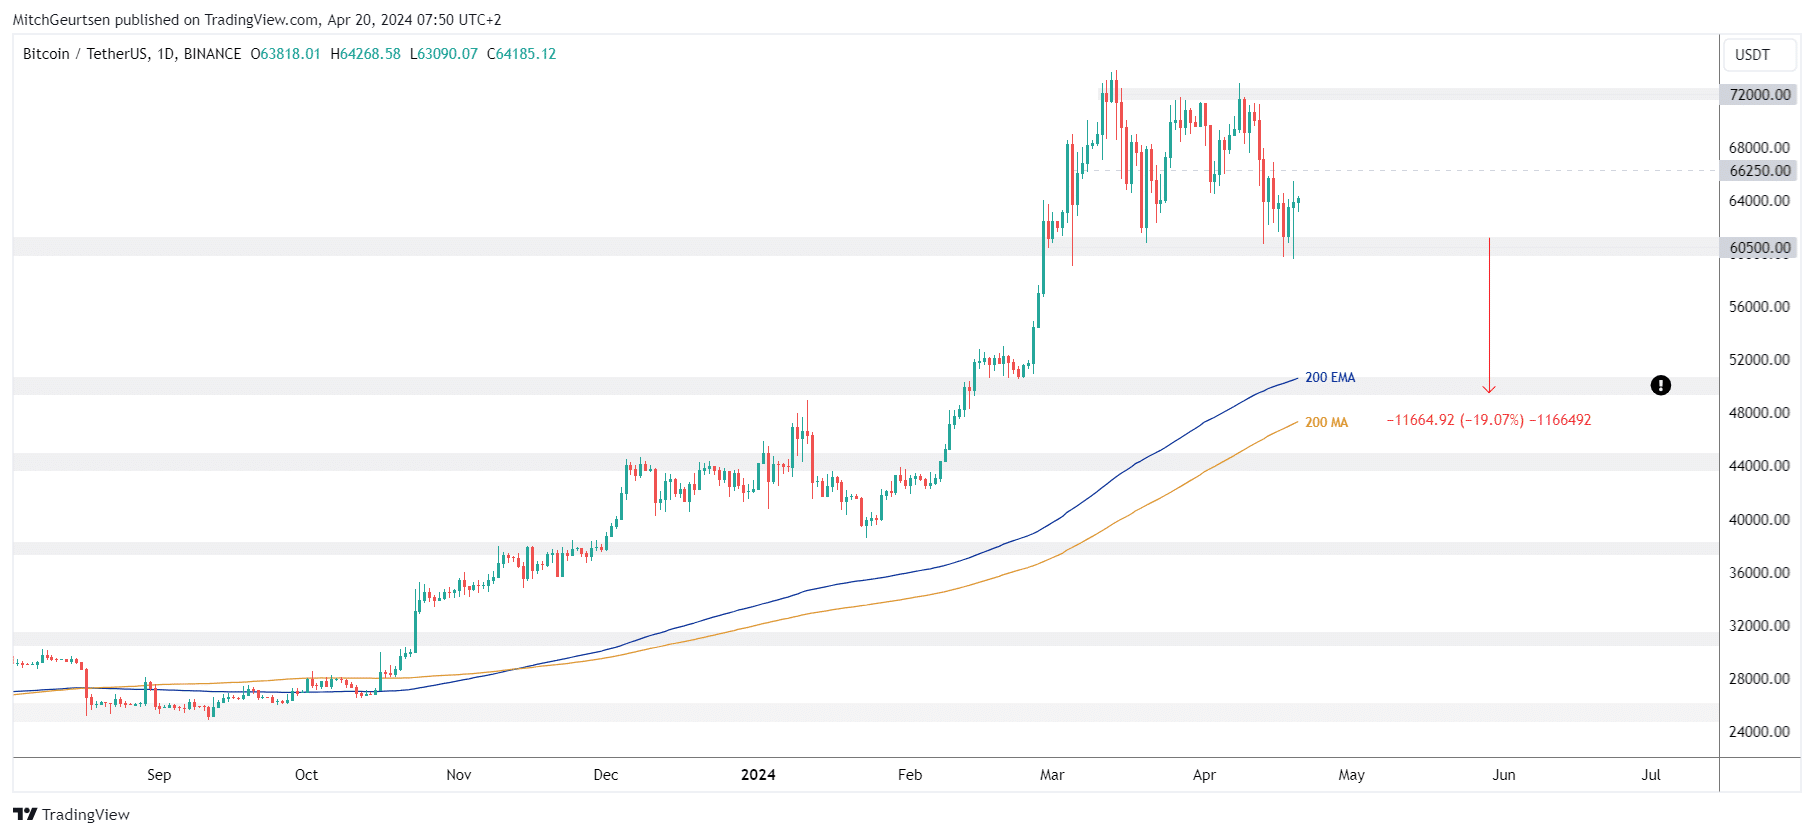
We’ll start our update with an analysis of the daily chart, as this higher time frame gives a clear picture of the overall market picture. What do we see when we look at this bigger picture?
There are some important points to mention. First, the price is in a range that roughly varies between $60,000 and $72,000. Over the last four weeks or so, the price has fluctuated within this wide range of about 20%. Both the upper and lower limits of this range have now been tested several times.
As long as we don’t drop below this range, you could expect us to move at least towards the middle of the range at $66,250 like last time, and possibly even towards the top end. A breakout from this price range would mean that the hunt for new record highs is on again. Yet the question remains whether we will reach the middle or even the top of the range in the very short term. There are developments in the lower time frames that can make this more difficult. We will provide more details on this later.
Should a downside breakout occur, the 200 MAs and the support area just above $50,000 are the price levels that will catch our attention. These are about 19% below the $60,000 support area.
We are not stating that this scenario will necessarily occur, but as long as the trend on the low time frames remains bearish, we should at least consider such a bearish scenario.
Bitcoin (BTC) 4 hour chart
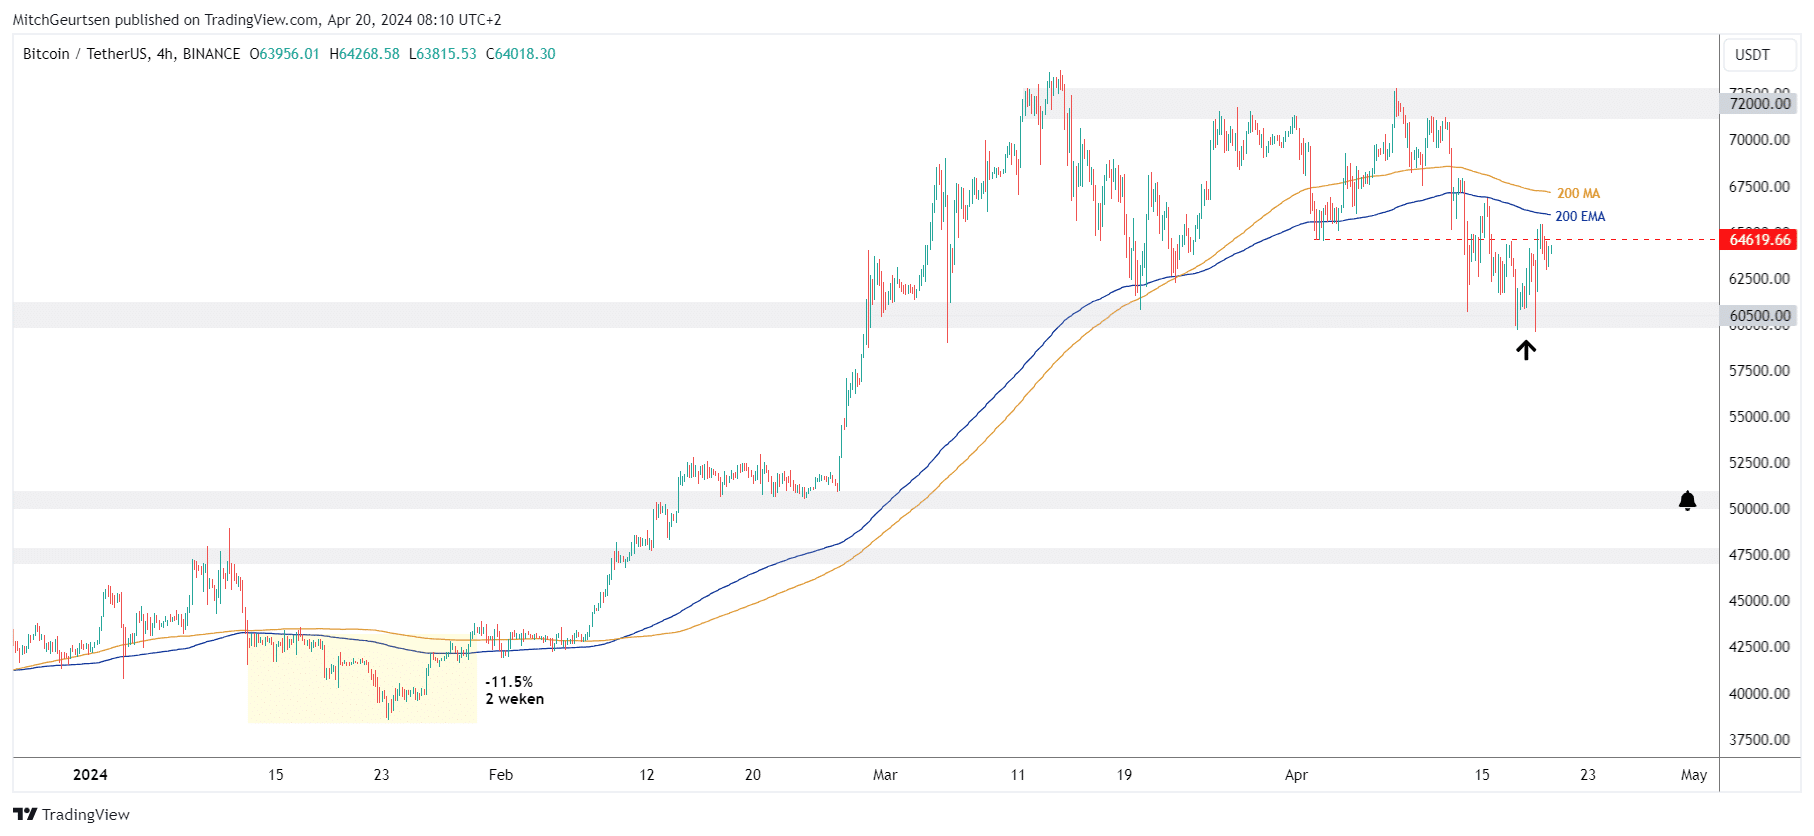
As previously discussed in our updates, the trend on this time frame turned bearish a week ago. We have observed a clear sign of weakness that cannot be ignored. This is what we noticed:
- For the first time since January 2024 we are trading below the 200 Moving Averages (MAs), see yellow box on the left.
- The previously bullish market structure has been bearishly broken by a lower low, marked by the red dotted line.
This means that we, as trend traders, assume that we are now dealing with a (temporary) downward trend. We do not rule out a further decline towards $50,000, as discussed in the daily chart. No one, including us, has the answer to questions about how long this temporary trend will last or how far the price will fall.
For us, this means that there is currently little to be achieved in the current market situation. We mainly focus on protecting the profits achieved in the past period. Returning our profits to the market is not an option for us!
Does this dramatically signal the end of the bull market? No! We just want to indicate that, just like at the beginning of this year, we may experience a downtrend for several weeks that could reduce the price by 10% to 20%.
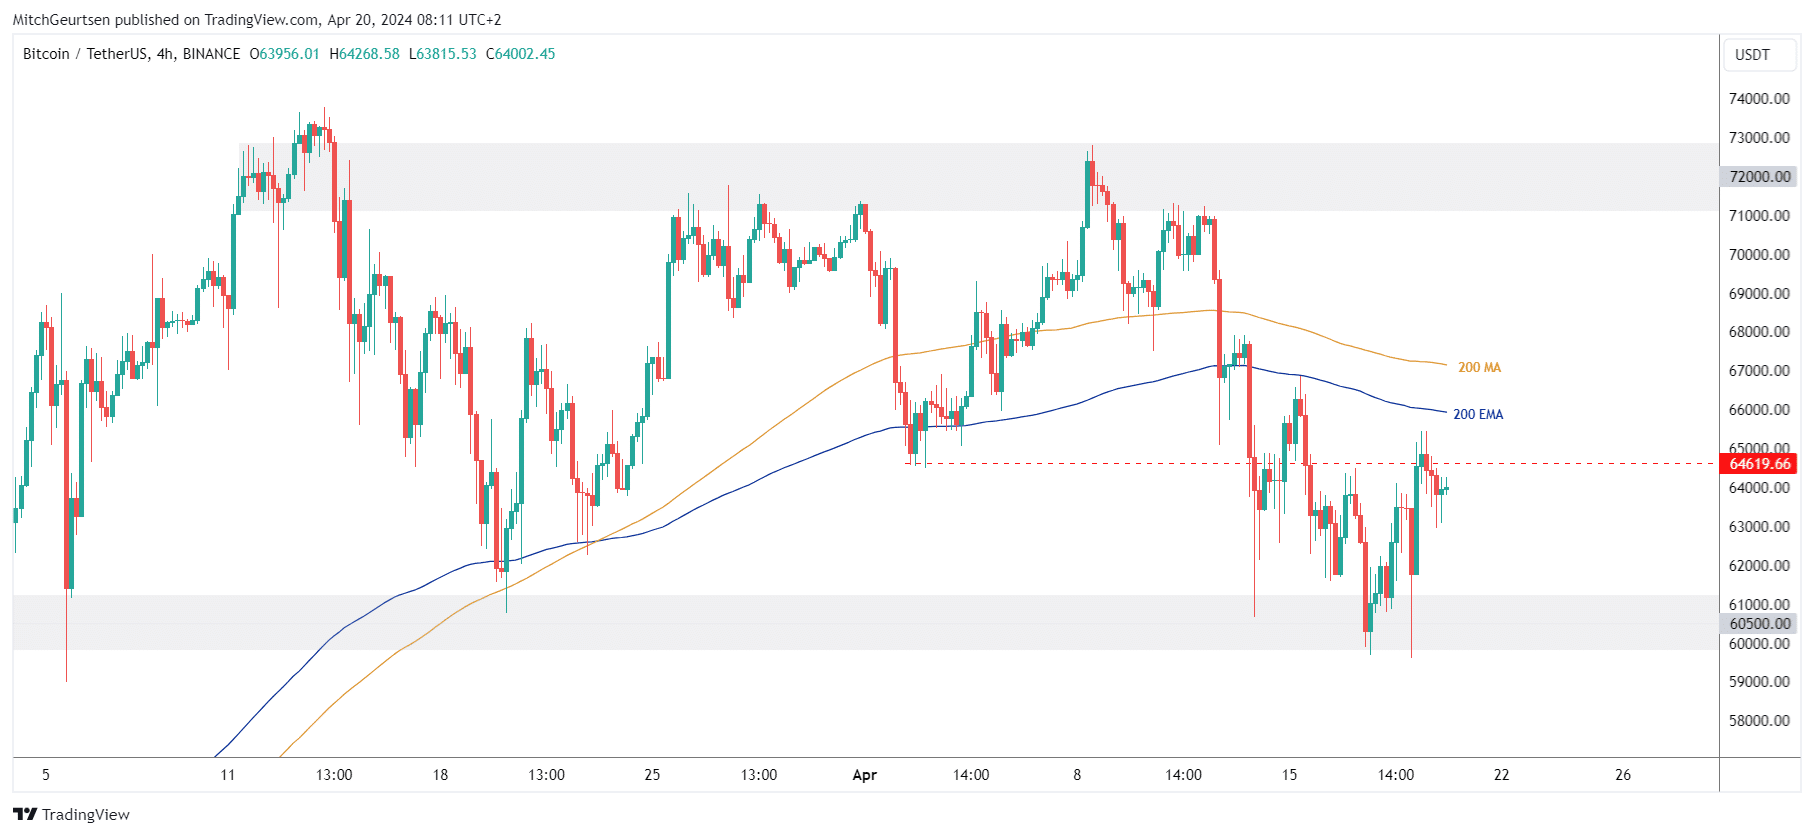
However, as soon as the first signs of strength become visible, we are ready to positively adjust our bearish expectations, with all the love. However, to do this we first need to recover the 200 MAs and develop a bullish market structure with higher lows and higher highs. Without these changes we simply cannot reach new heights. To clarify; In any case, regaining the MAs will have to happen first before we can set a new high.
So once we see a sign of strength, we are more than willing to shift our expectations and focus back to new highs for Bitcoin!
Bitcoin (BTC) 1 hour chart
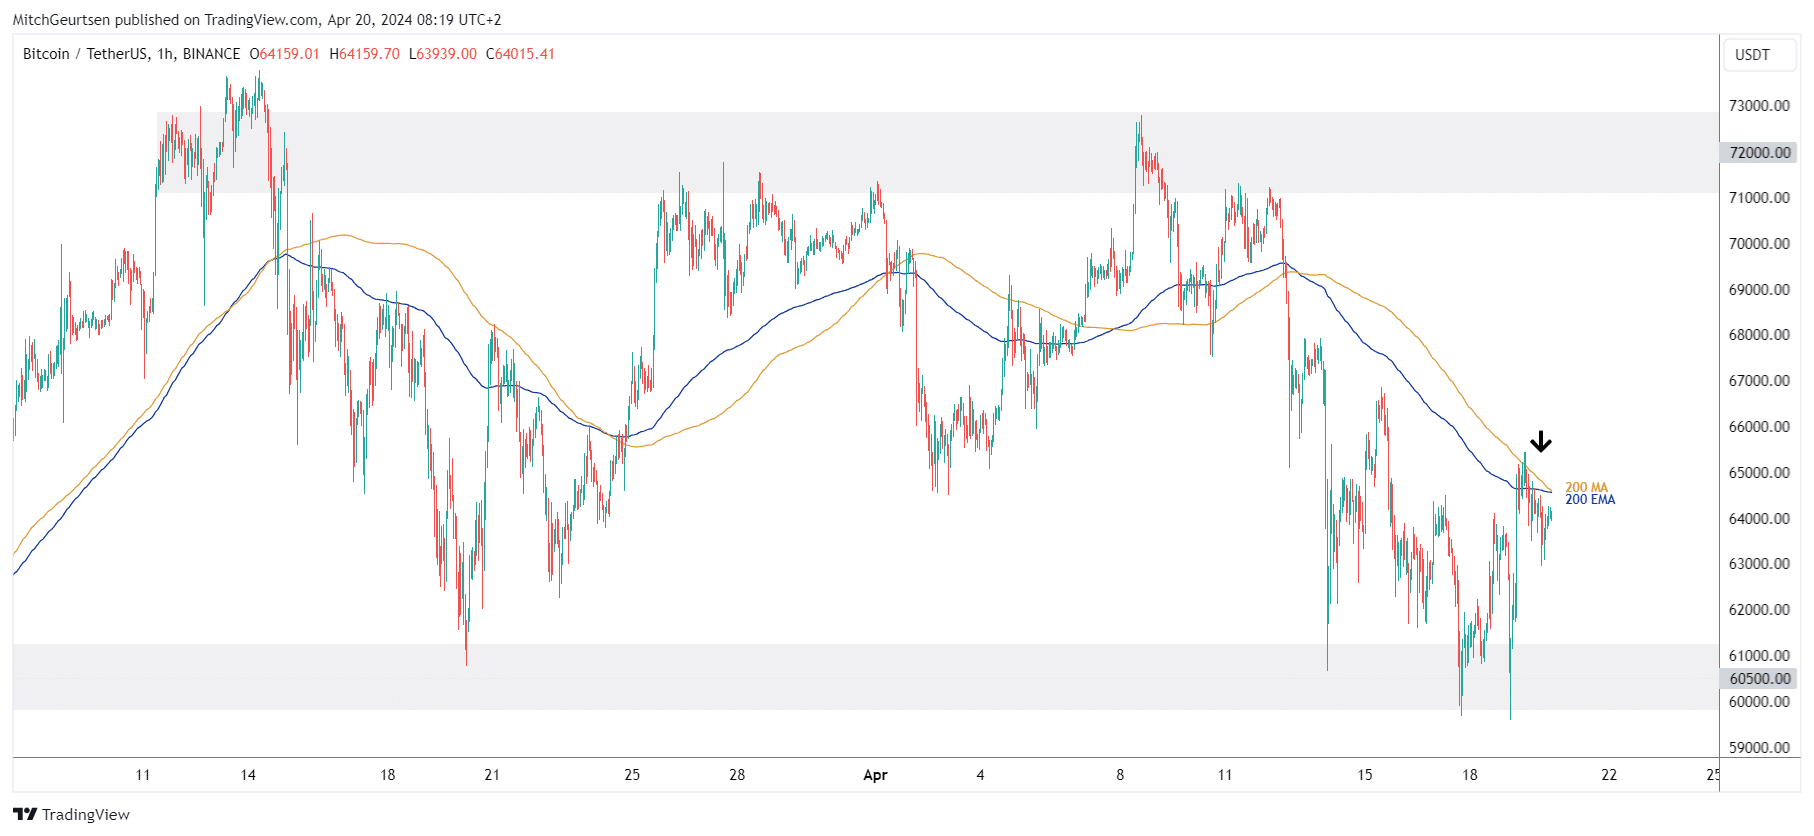
Zooming in even further on the 1 hour chart, it is noticeable that we are currently experiencing resistance from the 200 MAs on this low time frame. Breaking the MAs on this time frame would most likely lead to further upside towards the MAs on the 4-hour chart. We are eagerly awaiting how the price will behave.
However, if the price is rejected by these MAs, there is a good chance that we will return to the important support area around $60,000. Even then it will be exciting to observe how the price reacts to this situation.
The Bitcoin Webshop of the Netherlands and Belgium
Discover the ultimate Bitcoin experience in the Bitcoin Webshop of the Netherlands and Belgium, your one-stop-shop for everything related to Bitcoin! From unique Bitcoin coins and daily accessories that radiate your love for this digital revolution, to exclusive items such as Bitcoin 100K CavaBelgian Bitcoin Chocolateand the best Bitcoin Books. Celebrate the Bitcoin Bullrun 2024 with us and dive into a world full of innovation and freedom. Don’t miss our bestsellers and become part of the future today Bitcoin Debut!

Source: https://bitcoinmagazine.nl/nieuws/bitcoin-na-halving-rond-64k-uitdagingen-en-kansen