![]() In the past 24 hours, the Bitcoin price has fallen by 5%, but it seems to be finding support for the fifth time at an important trend support. At the same time, Altcoins have taken a huge hit, with declines of up to 20% and more. Is it realistic to expect an Altseason in the short term?
In the past 24 hours, the Bitcoin price has fallen by 5%, but it seems to be finding support for the fifth time at an important trend support. At the same time, Altcoins have taken a huge hit, with declines of up to 20% and more. Is it realistic to expect an Altseason in the short term?
Bitcoin remains dominant, just as in previous months, and is holding up reasonably well. Yet the tension increases every day. Is continuing the strong upward trend and reaching new highs in the near future still a viable scenario?
We will discuss this and more in detail in our latest Bitcoin Update!
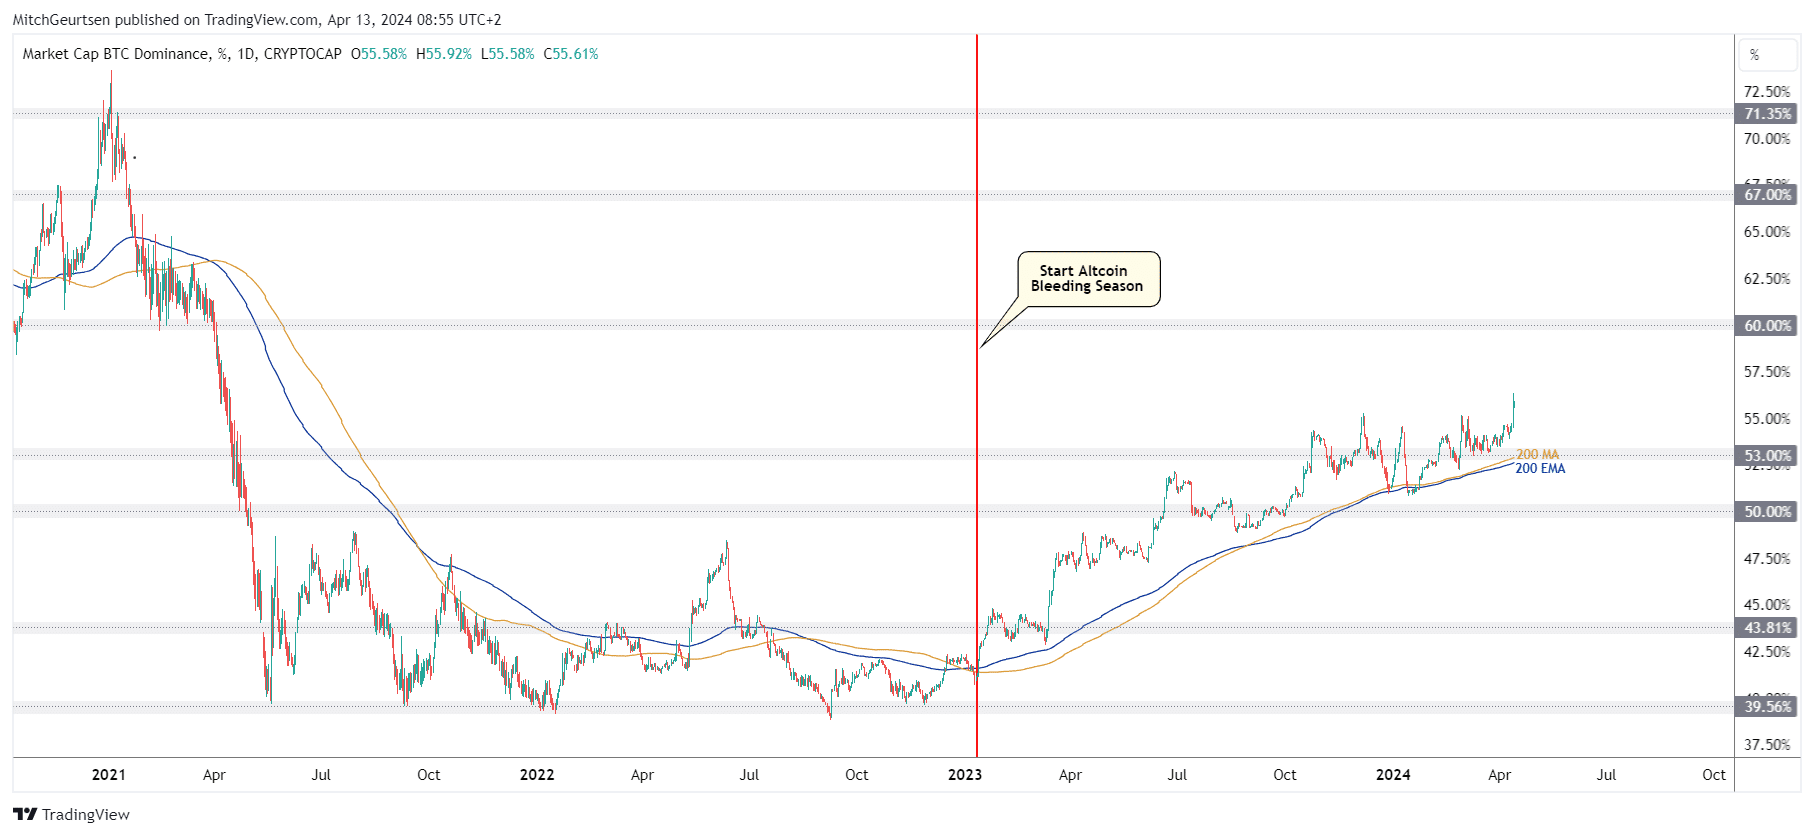
Bitcoin Dominance (BTC.D) Daily Chart
Despite a 5% decline in the past 24 hours, little seems to have changed for Bitcoin. This feels a bit strange, especially when we look at the Altcoin Market, which is not in good shape at the moment.
However, if we are honest, we have to acknowledge that this situation has been going on for months. We have indeed seen a number of Altcoins that experienced big pumps or a strong uptrend. Still, the general trend remains for Altcoins to lag behind Bitcoin, with only a few exceptions.
Bitcoin remains the leading currency. There’s no sign yet of an AltSeason before 2024, or even a starting Altseason. Altcoins continue to decline significantly in value against Bitcoin. At the moment, only a few Altcoins are holding up reasonably well.
In fact, since early 2023, when Bitcoin started a strong uptrend, we have been experiencing an ‘Altcoin Bleeding Season’. This can clearly be seen in the Bitcoin Dominance graph below. This is bad news for Altcoin traders as the dominance still has room to increase further towards 60%. This would spell disaster for almost all Altcoins. Moreover, we see no signs of a trend reversal yet, which could herald a possible start of an Altseason.
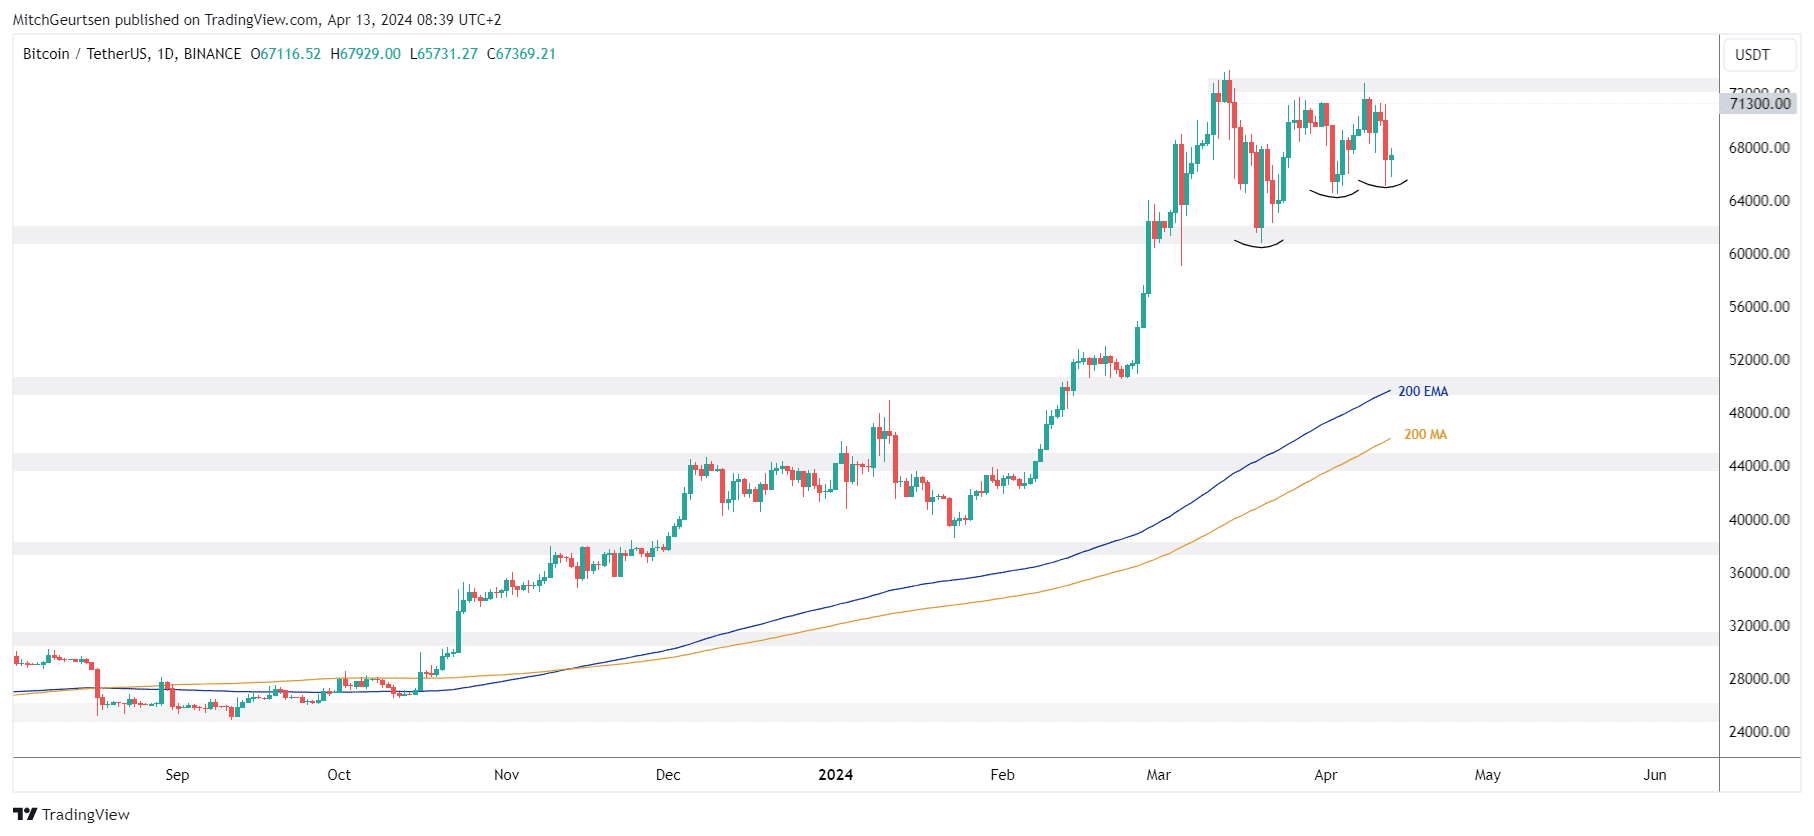
Bitcoin (BTC) Daggrafiek
Despite the recent 5% decline, Bitcoin is holding up quite well. The daily chart shows that there is nothing alarming going on.
So far, there are no clear signals that we have reached Bitcoin’s peak. We do not expect a major correction yet, as the price is still moving mainly sideways. Within this phase we continue to see higher lows.
However, on the 4-hour chart the situation becomes more tense. We test important trend support there. Loss of this support could lead to a trend reversal on this higher time frame. A lower low (lower low) instead of a higher low (higher low) after we have already set a lower high (lower high) would confirm a trend change from bullish to bearish. We have not seen this once before in recent months.
In this scenario, the next major support zone would be between $60,500 and $62,000. However, in the event of a trend change, the question is whether it will continue to decline until this zone. A further correction to test the 200 MAs for a bullish re-test after 18 months suddenly becomes a lot more realistic.
Losing trend support on the 4-hour chart combined with a trend change on the daily chart would pave the way for a deeper pullback and/or a temporary trend change. But this remains speculation for now and Bitcoin is still holding up well, a week before the Bitcoin Halving.
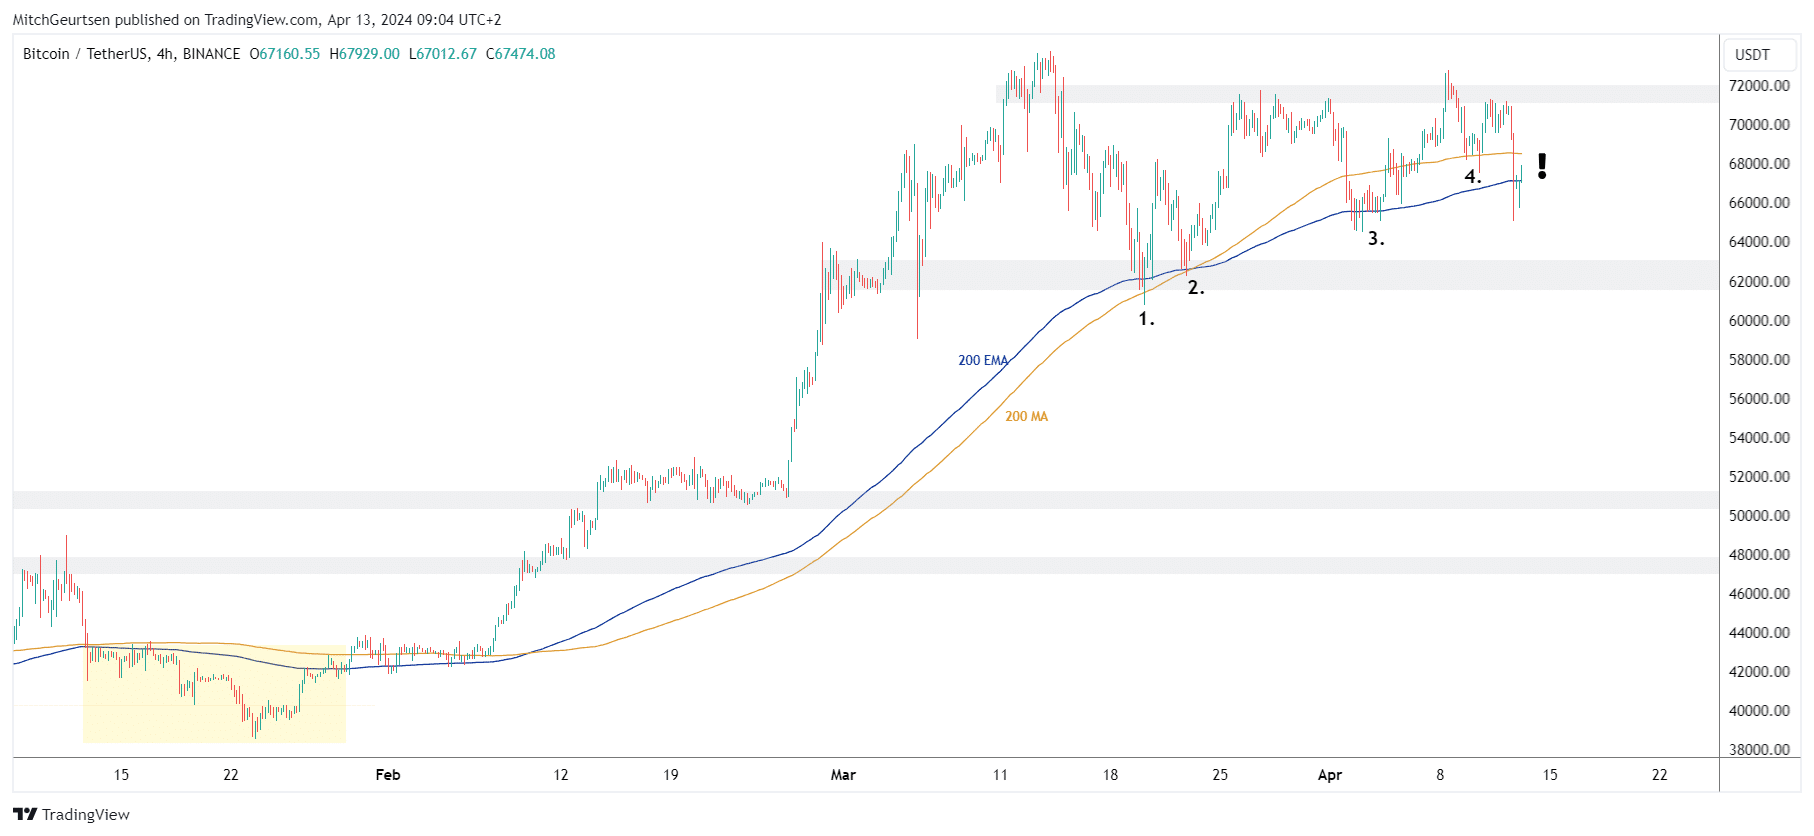
Bitcoin (BTC) 4 hour chart
Yesterday’s decline resulted in a test of the 200-day moving averages (MAs) for the fifth time. So far these MAs seem to be holding, but each new test brings more stress and makes the situation more critical.
We have been keeping a close eye on these MAs for weeks as they provide a good indication of the local trend on a shorter time frame than the daily chart. A break in this local trend will ultimately have consequences for the situation on the daily chart.
Since January 2024, we have not fallen below these 200 MAs on the 4-hour chart, as can be seen from the yellow box on the left of the chart. If this happens again after three months, we cannot dismiss it as something insignificant. Such a change in price after months is a signal that we should take seriously!
In summary, the loss of the 200 MAs should set us up for further decline. After breaking through these MAs, the decline can even be quite rapid. However, at the moment we are still finding support at local trend support, and on the daily chart there is still a sideways trend with higher lows. This still makes continuation of the strong uptrend a realistic scenario, especially in view of the upcoming Bitcoin Halving.
The Bitcoin Webshop of the Netherlands and Belgium
Discover the ultimate Bitcoin experience in the Bitcoin Webshop of the Netherlands and Belgium, your one-stop-shop for everything related to Bitcoin! From unique Bitcoin coins and daily accessories that radiate your love for this digital revolution, to exclusive items such as Bitcoin 100K CavaBelgian Bitcoin Chocolateand the best Bitcoin Books. Celebrate the Bitcoin Bullrun 2024 with us and dive into a world full of innovation and freedom. Don’t miss our bestsellers and become part of the future today Bitcoin Debut!

Source: https://bitcoinmagazine.nl/nieuws/bitcoin-heerst-harde-klappen-voor-altcoins-door-groeiende-dominantie