
Bitcoin’s run was nipped in the bud at the end of February and analysts also seem less bullish in their comments. The price is preparing for an exciting monthly close, what will it be?
Bitcoin momentum is gone for a while
Still above $50,000, bitcoin has lost bullish momentum over the past two weeks. Hope for an attack at higher levels remains for some, but there is hardly any buying pressure from the market.
A few important things are on the agenda in the coming days, such as macroeconomic data from the United States and the monthly closing on Thursday. Will that cause volatility?
The macroeconomic landscape in itself is precarious, because it is uncertain whether the Federal Reserve, the US central bank, will implement an interest rate cut now that the inflation figures are ‘disappointing’. Low(er) interest rates are usually good news for scarce assets such as bitcoin. Internally, Bitcoin is dealing with the halving, which is scheduled for April.
A number of price factors have been listed in an analysis by Cointelegraph.
Bitcoin monthly closing
Bitcoin continues to trade in a narrow range after the weekly close, which was in effect during the second half of February. At $51,700, the latest close provided little inspiration for the bulls, down about $450 from earlier, according to data from Cointelegraph Markets Pro and TradingView.
For the analysts at Material Indicators, there are important signals of a downturn. “This is a red W close for BTC with a new Trend Precognition (downward) signal,” they write on X (formerly Twitter).
That’s a red W close for #BTC with a new Trend Precognition ⬇️ signal. Signal is tentative until this new candle closes. I do expect it to validate, however we do have some wild cards with Thursday’s U.S. Economic Data coinciding with the Monthly Close.
Expecting more… pic.twitter.com/G3hBcTmE7w
— Material Indicators (@MI_Algos) February 26, 2024
Some popular market observers are more optimistic despite the sideways action. Among them is the Bitcoin analyst Munger. “Market makers now appear to have their eye on $53,000 shorts,” his X message reads. Data from CoinGlass shows that BTC/USD is still up over 20% in February.
$50k support continues to hold like a rock.
Market makers look like they now have their eye on $53k shorts.
Bitcoin bears are going to get wiped out this week. The road to $60k+ is on the horizon. Tick tock. #bitcoin https://t.co/6WuiME1HL9 pic.twitter.com/Lz4cNLg0p2
— Bitcoin Munger (@bitcoinmunger) February 25, 2024
Macro figures
The macro market this week is all about US jobs and spending data. The latter is known as an important inflation indicator of the Fed. Both figures are scheduled for February 29, and that could lead to price volatility.
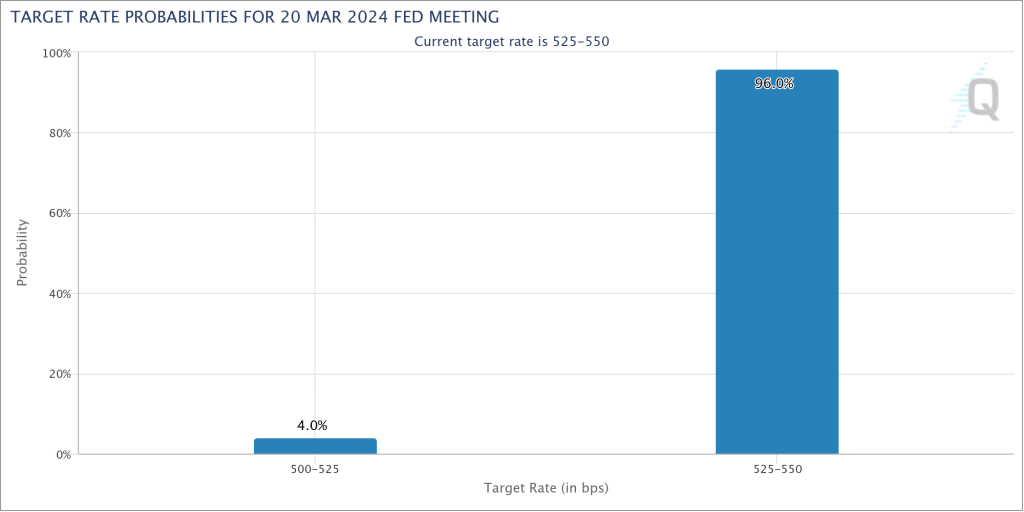
Employment trends drove market sentiment in January, while the Personal Consumption Expenditures (PCE) Index is crucial to the Fed’s policy when it comes to interest rate decisions. The figures come at a difficult time. Inflation data has recently exceeded expectations. Markets have significantly repriced the chances of a rate cut by the Fed at its March meeting.
According to data from CME Group’s FedWatch Tool, March currently only has a 4% chance of seeing rate cuts, with May at 25%.
“At the same time, optimism in US equities is such that the S&P 500 is close to historic highs. Last week it was all about Nvidia, this week it’s about the Fed again,” trade source The Kobeissi Letter writes in part of an X-message about this week.
Key Events This Week:
1. New Home Sales data – Monday
2. CB Consumer Confidence data – Tuesday
3. US Q4 2023 GDP data – Wednesday
4. January PCE Inflation data – Thursday
5. ~10% of S&P 500 companies report earnings
6. Total of 12 Fed speaker events this week
Another busy…
— The Kobeissi Letter (@KobeissiLetter) February 25, 2024
Bitcoin ‘pre-halving top’ signals
Bitcoin halvings often offer investors a “last buying opportunity” at the start of macro upward trends, says popular trader and analyst Rekt Capital. In one of its latest YouTube Shorts, Rekt Capital examines the BTC price retracements seen around the halving events of 2016 and 2020.
The first of these reached 40% of the local top just before the halving, while 2020 managed a correction of 19%. “But let’s say the pre-halving peak comes quite quickly,” he explains.
“Contrary to popular belief, I don’t think the halving will be a major price catalyst this year,” trader and analyst Rekt Capital warns in a post.
The video also explores the idea of a deeper dip, with $37,000 and $31,000 on the table as significant bottom levels based on historical halving behavior. Venturefounder, part of the on-chain analytics platform CryptoQuant, is also considering the possibility of a substantial BTC price drop.
For him, the 50-day moving average is a historical reference point. “Since the bottom of the Bitcoin cycle in 2023, every time BTC moved more than 12% above its 50-day moving average, there has been a correction,” he says on X.
Since #Bitcoin‘s cycle bottom in 2023, each time #BTC is over 12% above its 50-day moving average, there had been a correction. Each correction ended between 8-11% below its #50DMA
There had been 4 fractals for this, which one do you think is the current situation most similar… pic.twitter.com/otTNM5fInR
— venturefoundΞr (@venturefounder) February 24, 2024
The 50-day trendline currently sits at $45,700, a level that Venturefounder added is the dollar cost average (DCA) price for investors in the spot Bitcoin exchange-traded funds (ETFs), which launched last month. Nevertheless, he acknowledges that the trendline is moving higher and closer to the spot price, making it likely that the trendline will lose meaning if the market continues to track sideways.
Profit taking by speculators gives BTC price target of $48,000
Short-term holders (STHs) provide another reason to believe that a downward price decline may be in store for BTC. In one of his Quicktake market updates on February 25, CryptoQuant contributor CryptoOnChain warns of potential profit taking. By analyzing the Short-Term Holders’ Spent Output Profit Ratio (SOPR) metric, CryptoOnChain concludes that conditions will soon be right for speculators to distribute them to the market.
STH-SOPR measures the extent to which STHs – investors who hold BTC for 155 days or less – are making a profit relative to their purchase price. The 30-day moving average value of the metric hitting local highs coincides with BTC price retracements. Now, CryptoOnChain argues, bitcoin is “approaching sales territory for short-term investors.” “Examining the technical map also confirms this problem,” the analysis reads.
At the time of writing, the price is ~$51,300.
Source: https://bitcoinmagazine.nl/nieuws/pre-halving-top-binnenkort-aanstaande-voor-bitcoin-koers