
Bitcoin is currently hovering above $70,000 after successfully avoiding a dip below $60,000. This stable position is partly due to reduced outflows from most spot exchange-traded funds (ETFs), combined with anticipation of the upcoming halving event. With the recent break of two record highs within days, all eyes are on the possibility of another all-time high.
Tradingshot shares insights about bitcoin
TradingShot shared insights in a TradingView post on March 30. According to the analysis, bitcoin’s technical indicators strongly point to a bullish price target that could pave the way for a new all-time high of $78,000. The analyst pointed out that bitcoin follows a pattern observed in the S&P 500 index, albeit on different time frames. While bitcoin operates on a four-hour time frame, the S&P 500’s analysis is on a weekly time frame.
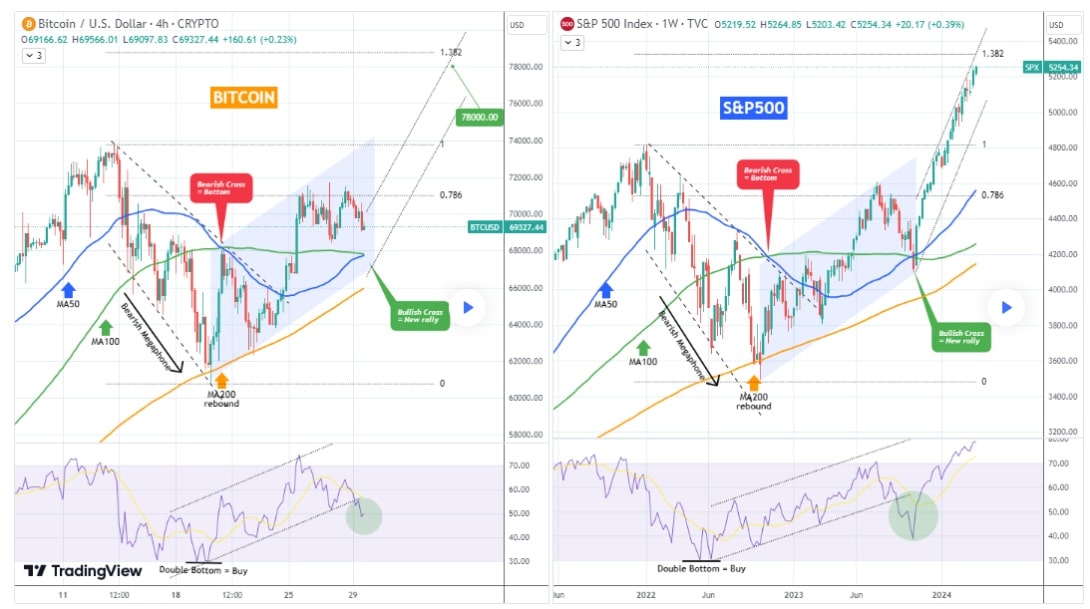
The analysis notes that bitcoin is returning to its four-hour average of 50 (MA50) and is about to form a bullish cross. The analyst draws parallels with the S&P 500 and suggests that investors should view this crossing as an important buy signal. This signal, just as it was for the S&P 500, started an aggressive rally of price increases.
Additionally, the comparison notes that the asset classes started a bearish pattern after their respective peaks. They then reached and maintained their 200-day average (MA200). From the perspective of the Relative Strength Index (RSI), both Bitcoin and the S&P 500 have been on a similar journey, with a pattern leading them into the overbought area after a double bottom formation in the oversold area.
He noted that based on this analysis, bitcoin is currently in the 0.786 rejection phase. Following the completion of this pullback, S&P 500 suggests that bitcoin’s immediate target should be around the 1,382 Fibonacci extension, resulting in a value of around $78,000.
Source: https://bitcoinmagazine.nl/nieuws/waarom-bitcoin-78000-doorbreken